SysUsage: the sysstat and sar grapher
What is SysUsage ?
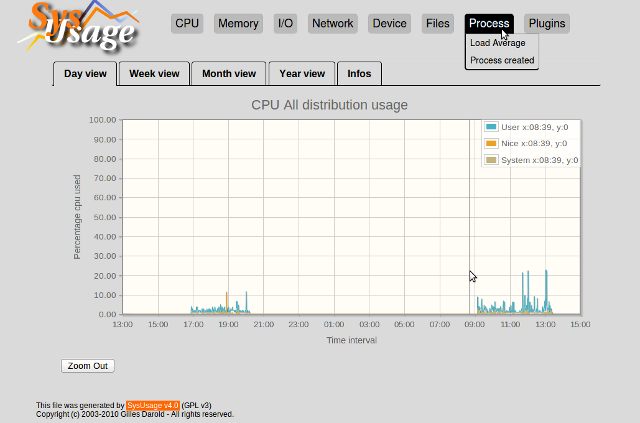
SysUsage continuously monitor your systems informations and generate periodical graph reports using rrdtool or javascript jqplot library. All reports are shown throught a web interface.
SysUsage grabs all system activities using Sar and system commands allowing you to keep tracks of your computer or server activity during his life. It is a great help for performance analysis and resources management. The threshold notification can alarm you when the system capabilities are reached by sending SMTP messages or throught Nagios reports.
By default it will monitor all you need to know on your server activity (See Features), it is written in Perl and should works on all Unix like plateforms. It doesn't require a Database system like MySQL or PostgreSQL but lie on rrdtool. In addition you can embeded your own plugins written in any programing language.
Since release 5.0 SysUsage can be run from a centralized place where collected statistics will be stored and where graphics will be rendered. Unless other monitoring tools with lot of administration work, SysUsage is design to have the lesspossible things to configure and a high level of admin system knowledge. Each server can also be self monitored and you just have to connect your browser to the web interface to know his health level.
SysUsage is design with simplicity in mind. I want all relevant statistics from my servers within an intuitive web interface and without spending too much time to configure it, if you know Nagios, you know what I mean. You will especially like SysUsage for that.
How to contribute ?
Any contribution to build a better tool is welcome, you just have to send me your ideas, feature requests, patches or plugins and there will be applied.
SysUsage development
Source Lines of Code: 8,136
Estimated Cost to Develop: $ 244,103
(Generated using David A. Wheeler's 'SLOCCount'.)
Copyright (c) 2003-2017 Gilles Darold - All rights reserved. (GPL v3).